Free MCAT study note
Michaelis-Menten Kinetics and Lineweaver-Burk Plots Explained
Enzyme kinetics questions on the MCAT look intimidating because they come wrapped in graphs, but nearly all of them reduce to two equations and one idea. This note builds that idea from scratch, then shows how the same data looks on a Michaelis-Menten plot and on a Lineweaver-Burk plot.
The idea: enzymes saturate
Imagine a fixed amount of enzyme and a growing amount of substrate. At low substrate concentration, most enzyme molecules are empty, so every extra bit of substrate finds a free enzyme and the reaction speeds up almost in proportion. At high substrate concentration, nearly every enzyme is busy. Adding more substrate cannot speed things up, because the enzymes are working as fast as they can. The rate levels off. That plateau is the maximum velocity, Vmax.
The simplest model of this behavior treats catalysis as two steps: the enzyme (E) and substrate (S) bind reversibly to form the enzyme-substrate complex (ES), and ES converts to product (P) and releases free enzyme.
E + S ⇌ ES → E + P
The first step is fast and reversible. The second step, with rate constant kcat, is the chemical step. The model assumes you measure the initial velocity, early in the reaction, before product builds up and before much substrate is used up, so the reverse reaction from product can be ignored.
The Michaelis-Menten equation
Under the steady-state assumption (the concentration of ES stays roughly constant during the measurement) and with substrate in large excess over enzyme, the initial velocity is:
v = Vmax [S] / (Km + [S])
Two constants define the curve.
- Vmax is the velocity when all of the enzyme is saturated. It equals kcat times the total enzyme concentration: Vmax = kcat[E]total. Doubling the enzyme doubles Vmax.
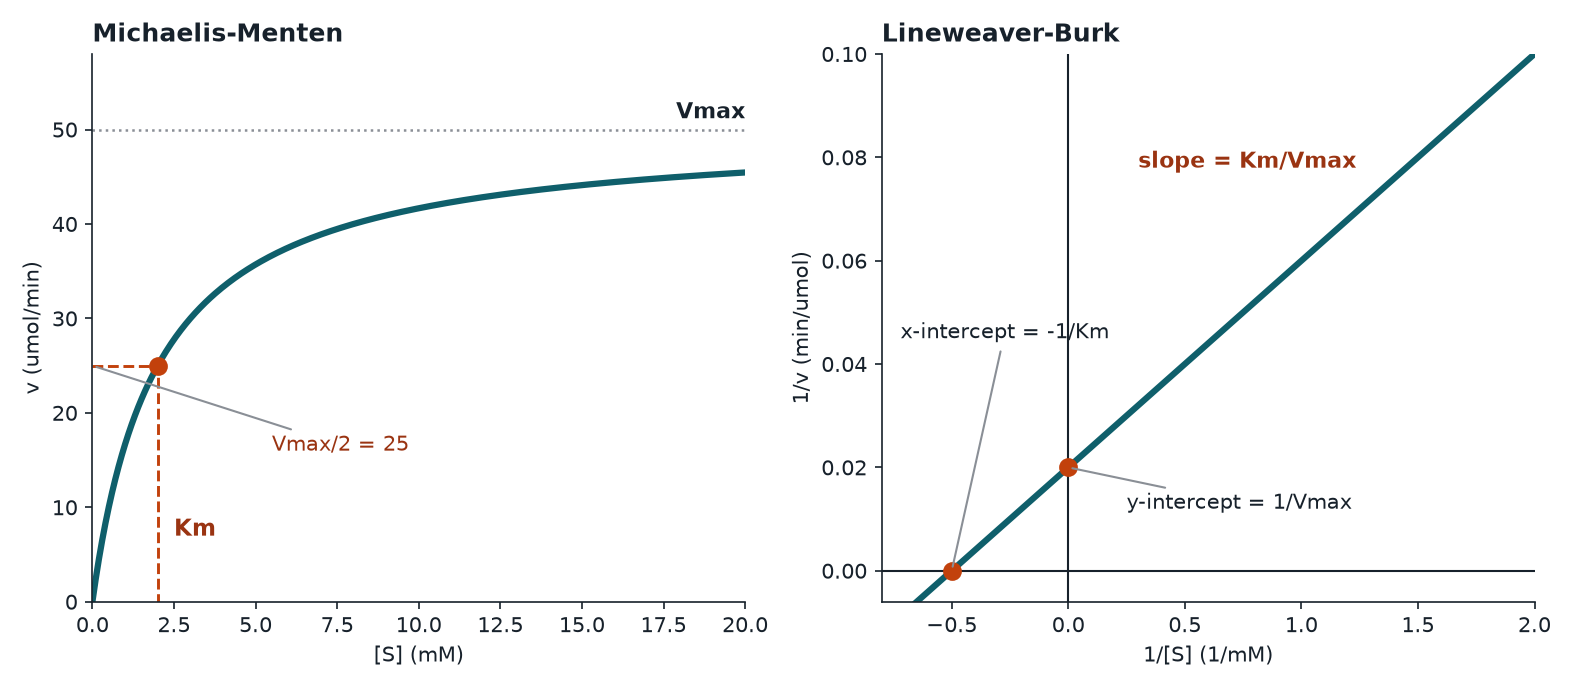
- Km, the Michaelis constant, is the substrate concentration at which the velocity is exactly half of Vmax. It has units of concentration and does not change when you add more enzyme.
Check the half-Vmax claim yourself
Put [S] = Km into the equation. You get v = Vmax Km / (Km + Km) = Vmax / 2. That is the definition of Km in action, and it is how you read Km off the left-hand graph: find half of the plateau on the y-axis and drop down to the x-axis.
The curve approaches Vmax only gradually. At [S] = 9 Km the velocity is 90 percent of Vmax, and at [S] = 99 Km it is 99 percent. You never actually reach Vmax on the graph, which is why you cannot just read it off the highest data point.
Two limiting regimes
- [S] much smaller than Km: the denominator is about Km, so v is about (Vmax/Km)[S]. The rate is proportional to substrate (first order in S).
- [S] much larger than Km: the denominator is about [S], so v is about Vmax. The rate does not depend on substrate (zero order in S).
What Km does and does not tell you
A low Km means the enzyme reaches half of its top speed at a low substrate concentration. In the common case where the chemical step is slow compared with substrate unbinding, a low Km goes along with tight substrate binding, so students are taught to read low Km as high affinity and high Km as low affinity. That is a good working rule for the exam.
It is a rule of thumb rather than a law. In the full model, Km = (k-1 + kcat) / k1, where k1 and k-1 are the binding and unbinding rates. Km equals the true dissociation constant of ES only when kcat is much smaller than k-1. If a passage emphasizes a very fast catalytic step, be cautious about equating Km with affinity.
kcat and catalytic efficiency
kcat, the turnover number, is the number of substrate molecules one enzyme active site converts to product per second when saturated. Calculate it as Vmax divided by the total enzyme concentration. For example, if Vmax is 5 µM per second and the enzyme concentration is 0.01 µM, then kcat is 500 per second.
To compare enzymes or substrates, use kcat/Km, the catalytic efficiency. It combines speed (kcat) and how well the enzyme grabs substrate at low concentrations (Km). A higher ratio means a better enzyme for that substrate. Its upper limit is set by how often enzyme and substrate collide in solution, roughly 108 to 109 M-1 s-1. An enzyme near that ceiling is called catalytically perfect.
Linearizing the curve: Lineweaver-Burk
A hyperbola is hard to analyze by eye, because you can never read Vmax from the plateau with confidence. Taking the reciprocal of both sides of the Michaelis-Menten equation turns the curve into a straight line:
1/v = (Km / Vmax) (1/[S]) + 1/Vmax
This has the form y = mx + b, with 1/v on the y-axis and 1/[S] on the x-axis. So:
- y-intercept = 1/Vmax (the point where 1/[S] is zero, which is infinite substrate)
- slope = Km/Vmax
- x-intercept = -1/Km (set 1/v to zero and solve)
A quick way to remember the x-intercept: it is negative, so it sits to the left of the y-axis, and a larger Km puts it closer to zero.
Worked example
An enzyme has Vmax = 50 µmol/min and Km = 2 mM.
- Velocity at [S] = 6 mM: v = 50 × 6 / (2 + 6) = 37.5 µmol/min.
- Lineweaver-Burk y-intercept: 1/50 = 0.020 min/µmol.
- Slope: Km/Vmax = 2/50 = 0.040.
- x-intercept: -1/Km = -0.5 mM-1.
- Check at [S] = 6 mM, so 1/[S] = 0.1667: 1/v = 0.040 × 0.1667 + 0.020 = 0.0267, and 1/0.0267 = 37.5. The two methods agree.
Reading changes on a Lineweaver-Burk plot
Questions often show two lines, one with and one without some treatment, and ask what changed. Use the intercepts.
- Line crosses the y-axis higher than the control: 1/Vmax is larger, so Vmax is lower.
- Line crosses the x-axis closer to zero than the control: -1/Km is smaller in magnitude, so Km is larger.
- Steeper slope: the ratio Km/Vmax is larger. Either Km rose, Vmax fell, or both.
- Parallel lines: the slope Km/Vmax is unchanged, so Km and Vmax changed by the same factor.
The next note, on the four inhibition types, applies exactly this skill.
Why Lineweaver-Burk is for reading, not for fitting
The reciprocal transformation stretches small velocities into huge numbers. Measurements taken at low substrate concentrations, which are the least precise, end up dominating the line, while precise data at high [S] get squeezed together near the y-axis. That is why researchers fit the hyperbola directly with software today. For the MCAT, the double-reciprocal plot remains the standard way to show and compare kinetic parameters because the intercepts are so easy to read.
Assumptions behind the equation
- You measure initial velocity, so product is negligible.
- Substrate is in large excess over enzyme, so binding does not noticeably deplete the free substrate.
- The ES complex is in a steady state.
- The enzyme follows simple hyperbolic behavior. Allosteric, cooperative enzymes do not. They produce a sigmoidal (S-shaped) velocity curve and need a different treatment, so a sigmoidal curve in a passage is a clue that the Michaelis-Menten equation does not apply.
Common traps
- Mixing up reciprocals. A bigger Km on the Lineweaver-Burk plot means the x-intercept moves toward zero, not away from it.
- Reading Vmax from the top of the data. Vmax is the asymptote of the hyperbola, or the reciprocal of the y-intercept.
- Thinking Vmax is a property of the substrate. It depends on how much enzyme is present. Km and kcat are the properties of the enzyme-substrate pair.
- Forgetting units. Km is in concentration units, Vmax is in rate units, and kcat is in inverse time.
One-minute recap
v = Vmax[S]/(Km + [S]). Km is the substrate concentration giving half of Vmax. Low Km usually means high affinity. Vmax = kcat[E]total. On a Lineweaver-Burk plot the y-intercept is 1/Vmax, the x-intercept is -1/Km, and the slope is Km/Vmax.
Check yourself: 5-question mini-quiz
1. An enzyme has Vmax = 80 units/min and Km = 4 mM. What is the velocity at [S] = 4 mM, and at [S] = 12 mM?
At [S] = Km the velocity is half of Vmax, so 40 units/min. At 12 mM: 80 x 12 / (4 + 12) = 60 units/min.
2. On a Lineweaver-Burk plot, the x-intercept is -0.25 per mM. What is Km?
The x-intercept equals -1/Km, so Km = 1/0.25 = 4 mM.
3. Doubling the enzyme concentration (with the same substrate) changes which kinetic constants?
Vmax doubles because Vmax = kcat[E]total. Km and kcat do not change, because they are properties of the enzyme-substrate pair rather than of how much enzyme is present.
4. A Lineweaver-Burk line for a treated enzyme crosses the y-axis at a higher value than the control and crosses the x-axis at the same point. What happened to Vmax and Km?
Vmax decreased (a higher y-intercept means 1/Vmax is larger, so Vmax is smaller) and Km is unchanged (same x-intercept).
5. Why is a sigmoidal velocity curve a warning sign for a Michaelis-Menten analysis?
Michaelis-Menten kinetics predict a hyperbola. A sigmoidal curve points to cooperativity between subunits (allosteric behavior), which the simple equation does not describe.
Keep studying
- Enzyme Inhibition Types Compared: Competitive, Noncompetitive, Uncompetitive, Mixed
- The Seven Enzyme Classes (EC 1 to 7) With Examples and Traps
- The Henderson-Hasselbalch Equation for the MCAT
- All free notes